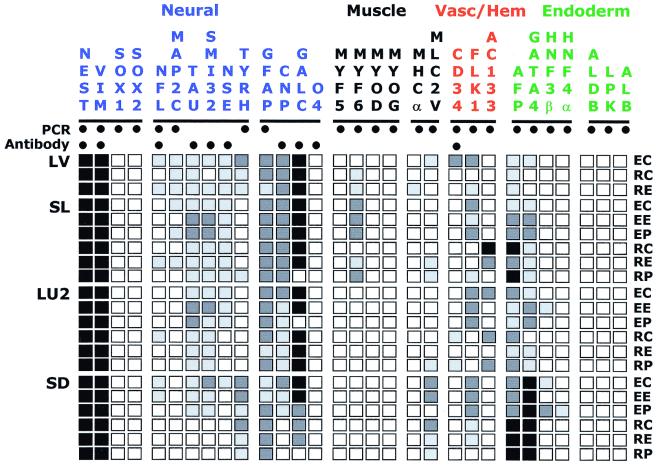
Figure 3.
Expression profiles of four EBD cultures. Markers and lineages are
listed above and are grouped by lineage affiliation. Assay type is
indicated by ● for PCR, antibody, or both.
Culture identity is indicated at left, growth environment on right, as
follows: E, EGM2MV media; R, RPMI/15% serum media; C, collagen
I-coated surface; E, human extracellular matrix-coated surface; P,
tissue culture-treated plastic surface. Expression levels are indicated
as follows: ■, very strong;
 , strong;
 , detected;
□, not detected.

