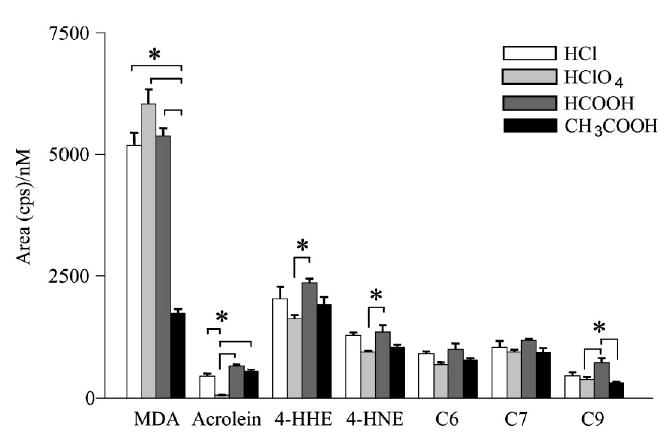
Figure 2.

Comparison between the intensities of the MS response obtained using four different acids for the derivatization of aldehydes with DNPH at room temperature. EBC samples spiked with aldehyde mixtures at nine concentration levels between 25 nM and 10 μM were derivatized using a 12 mM DNPH solution acidified with hydrochloric, perchloric, formic or acetic acid, and then analyzed by LC/ESI-MS/MS (PI for MDA and NI for all other aldehydes). The histograms show the slopes of the calibration curves calculated in the 25 nM to 10 μM range for each DNPH hydrazone and for each treatment. Comparisons between different acid treatments were made by one-way ANOVA followed by Tukey’s test (*p<0.05).
