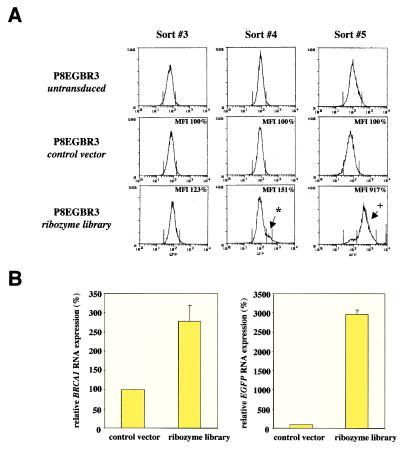
Figure 2.
Selection of ribozymes that up-regulate the BRCA1 promoter. (A) FACS-selection of P8EGBR3 cells (untransduced, control vector, or ribozyme-library-transduced) for cells with an increase in EGFP expression. Rz library-transduced cells show a peak on sort #4 (*) and a shift of the majority of the population on sort #5 (+), whereas control vector or untransduced cells remain unchanged throughout the experiment. MFI, mean fluorescence intensity of cell population, given in percent of control vector transduced cells. (B) Quantitative real-time RT-PCR analysis of EGFP and endogenous BRCA1 RNA normalized to GAPDH RNA after sort #5 in cells transduced with control vector or ribozyme library. Numbers are given as relative RNA levels in percent compared with control vector transduced cells (mean ± SEM).

