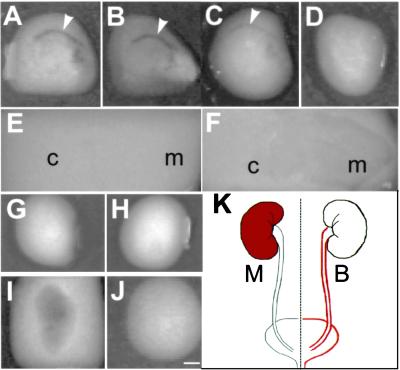
Figure 4.
Distribution of plasminogen activator activities in bovine vs. mouse urinary tract. Frozen tissue sections (10 μm) were air dried and preincubated at 37°C for 30 min with PBS (A), anti-tPA (B), anti-uPA (C), and a mixture of anti-tPA and anti-uPA (D) before they were overlaid with an (opaque) fibrin-containing indicator gel and incubated at 37°C for 30 min. Fibrinolysis by plasminogen activator results in a clear zone. (A–F) Sections of bovine bladder (A–D) or kidney (E, F). Note the strong fibrinolytic activities in the urothelial zone (arrowheads) and their complete inhibition by a mixture of anti-tPA and anti-uPA. The bovine kidney sections were incubated with the indicator gel for a prolonged period of 3 h (E) and 8 h (F) to show the barely detectable PA activities. (G–J) Sections of mouse bladder (G and H) or kidney (I and J) that were overlaid with indicator gels with (G and I) or without (H and J) plasminogen. Note the strong fibrinolytic activities in mouse kidney (I) and their absence in mouse bladder (G). (K) Site of PA production (marked red) in the urinary tracts of mouse (M) and bovine (B). c, cortex; m, medulla. All pictures are of the same magnification. (Bar = 5 mm.)

