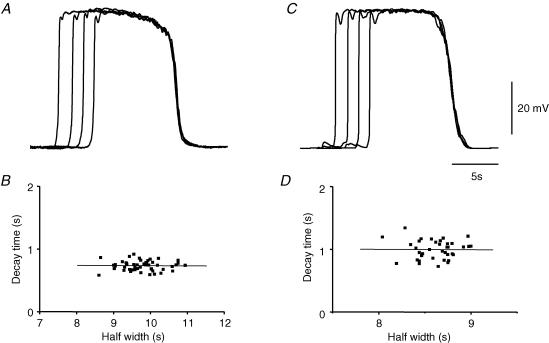
Figure 6. Termination phases of pacemaker potentials generated by ICC-MY.
Selected pacemaker potentials, with varying durations, are shown with recovery phases overlaid, A. Note that regardless of their half-widths, the pacemaker potentials terminated with very similar time courses, resting membrane potential −65 mV. When the decay time (70%–20%) was plotted against half-width for a sequence of pacemaker potentials, B, a systematic correlation between the two characteristics (R=−0.02; gradient −0.003) was not detected. When a set of pacemaker potentials was simulated so that their durations varied, C (see text for details), their recovery phases were again similar. The relationship between decay time and half-width, D, showed no systematic correlation (R=−0.01; gradient −0.007). The voltage and time calibration bars apply to panels A and C.

