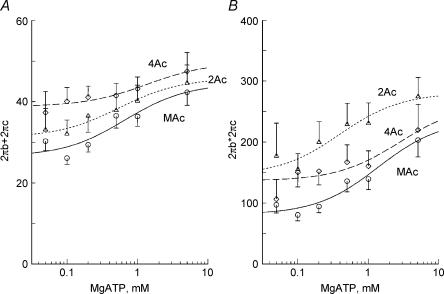
Figure 7. The effect of MgATP on sum (A) and product (B) of the rate constants 2πb and 2πc.
The data were obtained from the same experiments shown in Fig. 3. The sum and product of the rate constants 2πb and 2πc are plotted as a function of the MgATP concentration. ▵, 2Ac reconstituted myocardium (n= 6–14); ♦, 4Ac reconstituted myocardium (n= 5–10); ○, muscle actin (MAc) reconstituted myocardium (n= 13–14). Continuous curves are based on eqns (2) and (3) with best fit parameters.

