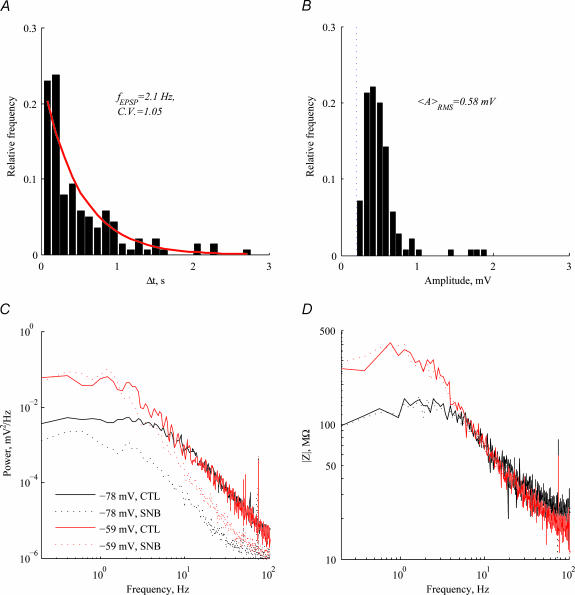
Figure 6. The effect of synaptic blockers on voltage noise.
A, inter-EPSP interval histogram for one cell. Detected EPSPs had a mean frequency of 2.1 Hz. The red line marks the fit to an exponential distribution expected from Poisson statistics of EPSPs. B, EPSP base-to-peak amplitude histogram for the same cell. Root-mean-squared amplitude was 0.58 mV. The broken blue line marks the detection threshold in this cell, resulting from the noise. C, application of synaptic blockers attenuates the voltage PSD at high frequencies, revealing a dependence on holding potential. D, impedance depends on holding potential (black versus red as in C) but is independent of synaptic activity (continuous versus dotted lines).

