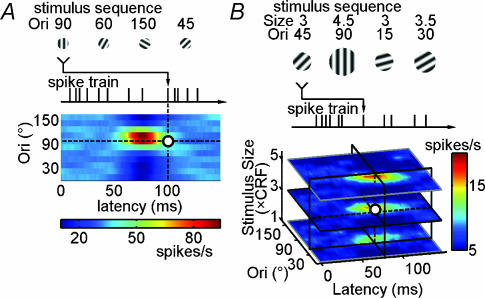
Figure 1. Reverse correlation method for analysing the cortical responses to dynamic grating stimuli.
A, dynamic grating stimuli (at a fixed stimulus size), cortical spike train, and the temporal-orientation matrix (TOM) representing the response of a V1 neurone as a function of both stimulus orientation and latency (colour scale shown below). B, dynamic grating stimuli in which both orientation and size of the grating varied in a pseudorandom sequence, and the tuning of the cell is represented by a three-dimensional matrix, in which the response is a function of orientation, latency and stimulus size.

