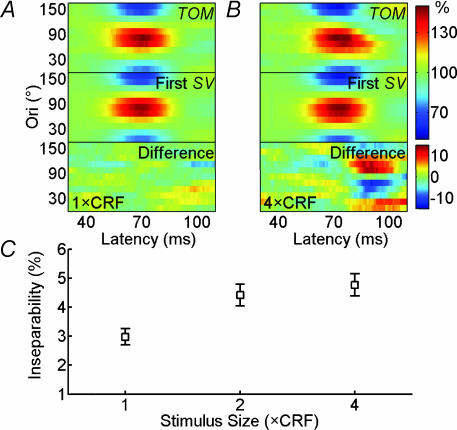
Figure 7. Stimulation of nCRF increases orientation–time inseparability of cortical neurones.
A, TOM, its first singular vector reconstructed matrix, and the difference between these two matrixes for an example neurone at 1 × CRF (in unit of the percentage of the mean spike rate). Inseparability index was 1.71. B, same as A, but at 4 × CRF. The relatively high inseparability index (7.83) is largely caused by the tilt (upper-left to lower-right) of the TOM profile, which indicates a downward shift in the preferred orientation over time. C, inseparability index (see eqn (7) in Methods) as a function of stimulus size for 126 neurones. Error bar, ±s.e.m. The indices obtained with nCRF were significantly larger than those with CRF only, in all cortical layers; layer 2/3: 2.8 ± 0.5 for 1 × CRF versus 4.1 ± 0.7 (P < 0.001, paired t test) and 4.8 ± 0.7 (P < 10−4) for 2× and 4 × CRF, respectively, n = 44; layer 4: 5.1 ± 1.2 versus 6.2 ± 1.5 (P < 0.05) and 6.3 ± 1.5 (P < 0.05), n = 14; layer 5/6: 3.6 ± 0.5 versus 5.3 ± 0.7 (P < 0.001) and 5.3 ± 0.7 (P < 0.001), n = 33. This effect was also found for both simple and complex cells; simple cells: 4.7 ± 0.6 for 1 × CRF versus 6.5 ± 0.9 (P < 0.01, paired t test) and 6.2 ± 0.8 (P < 0.01) for 2× and 4 × CRF, respectively, n = 30; complex cells: 2.4 ± 0.3 versus 3.8 ± 0.4 (P < 10−8) and 4.3 ± 0.4 (P < 10−10) n = 96. Cells with or without inhibitory nCRF also had a similar effect. Inhibitory: 2.7 ± 0.3 for 1 × CRF versus 4.1 ± 0.4% (P < 10−5 paired t test) and 4.3 ± 0.4 (P < 10−6) for 2× and 4 × CRF, respectively, n = 68; facilitatory: 3.2 ± 0.6 for 1 × CRF versus 4.2 ± 0.7 (P < 0.001) and 4.9 ± 0.7 (P < 10−5) for 2× and 4 × CRF, n = 42; neither facilitatory nor inhibitory: 3.5 ± 1.0 for 1 × CRF versus 6.4 ± 1.6 (P < 0.001) and 6.5 ± 1.6 (P < 0.001) for 2× and 4 × CRF, n = 16.

