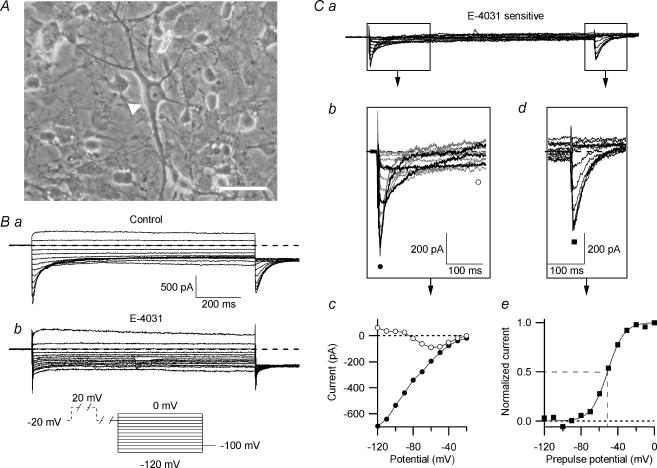
Figure 2. The E-4031-sensitive erg current in embryonic rhombencephalon neurones.
A, photograph of a primary culture of rat embryonic rhombencephalon (E15) held in culture for 5 days. Neurones of various magnitude and shape were present. Predominantly, the large multipolar neurones (arrowhead) were chosen for this study. Scale bar: 40 μm. Ba, control currents recorded in 40 mm K+ bath solution. From a holding potential of −20 mV, a 2 s pulse to 20 mV was applied, followed by a 500 ms gap at −20 mV, 1 s test pulses to potentials between 0 and −120 mV in steps of 10 mV and a final 200 ms potential step to −100 mV (see pulse diagram). Bb, same cell and pulse protocol as in B, but in the presence of 10 μm E-4031. Ca, E-4031-sensitive current, obtained by subtracting the current traces shown in Bb from those shown in Ba. Cb, the beginnings of the enlarged E-4031-sensitive current traces are depicted. Highlighted in black are current traces recorded at −50, −80 and −110 mV, demonstrating the characteristic potential-dependent time courses of recovery from inactivation and subsequent deactivation of erg currents. Cc, peak inward current amplitudes (•) and current amplitudes at 250 ms (○) plotted versus the test pulse potential. Cd, tail currents from Ca on enlarged coordinates. The peak current amplitudes were plotted against prepulse potential, and a Boltzmann function was fitted to the data points (Ce) with V1/1=−51.4 mV and the slope factor k= 8.7 mV.

