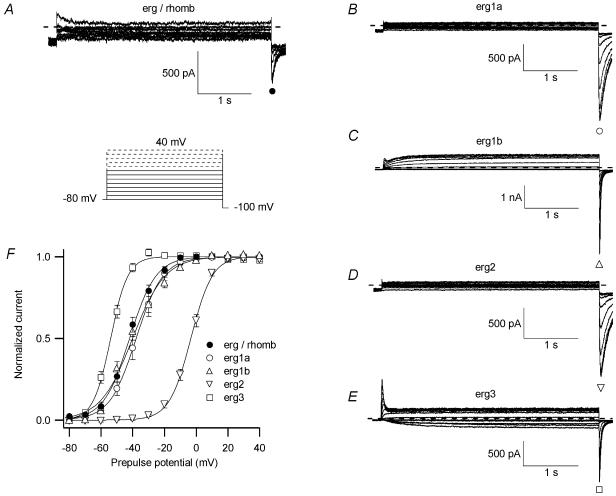
Figure 9. Voltage dependence of erg current activation.
A, E-4031-sensitive current measured in an embryonic rhombencephalon neurone to compare the neuronal erg current activation with that of erg1a (B), erg1b (C), erg2 (D) and erg3 (E) currents in CHO cells after expression of the different erg channels. The transient outward current shown in A is presumably a rundown artefact of an A-type current. The voltage dependence of activation was determined from a holding potential of −80 mV. Inward currents were elicited by a constant pulse to −100 mV following 4 s prepulses to potentials between −80 and 40 mV in steps of 10 mV to activate erg currents (see pulse diagram). The neuronal inward erg currents following the prepulses from 10 to 40 mV (dashed lines in pulse diagram) were omitted from the analysis, because they often were biased by rundown of other tail currents. F, means of normalized peak tail current amplitudes of rhombencephalic erg current (•; n= 10), as well as of erg1a (○; n= 6), erg1b (▵; n= 20), erg2 (▿; n= 6) and erg3 (□; n= 12) currents plotted against the prepulse potential.

