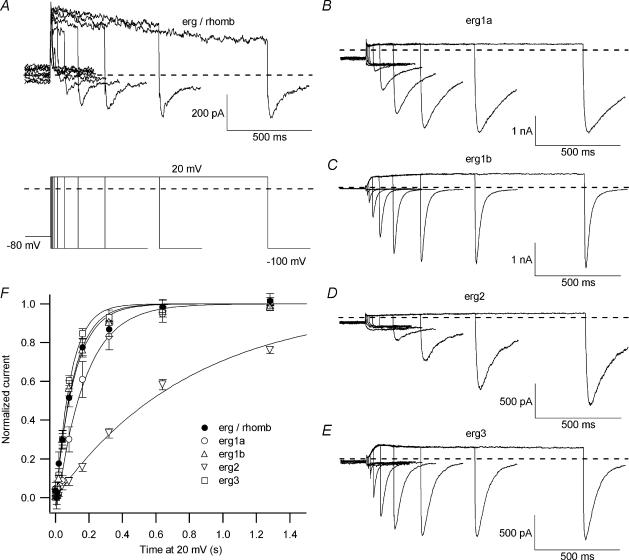
Figure 10. Time course of erg current activation.
The time dependence of erg current activation from embryonic rhombencephalon neurones (A, E-4031-sensitive current) compared with erg1a (B), erg1b (C), erg2 (D) and erg3 (E) currents expressed in CHO cells. A, part of the outward currents were probably due to rundown artefacts of an outwardly rectifying K+ current. The envelope-of-tail protocol (see pulse diagram) consisted of the following pulse sequence: from a holding potential of −80 mV a pulse to 20 mV of increasing duration was followed by a subsequent voltage step to −100 mV eliciting an inward tail current. The mean normalized peak tail current amplitudes of native erg current (•, n= 7) as well as of erg1a (○; n= 5), erg1b (▵; n= 11), erg2 (▿; n= 9) and erg3 (□; n= 4) currents were plotted against the duration of the pulse to 20 mV (F). The time constants of activation (τ) were determined by fitting the curves with a single exponential function.

