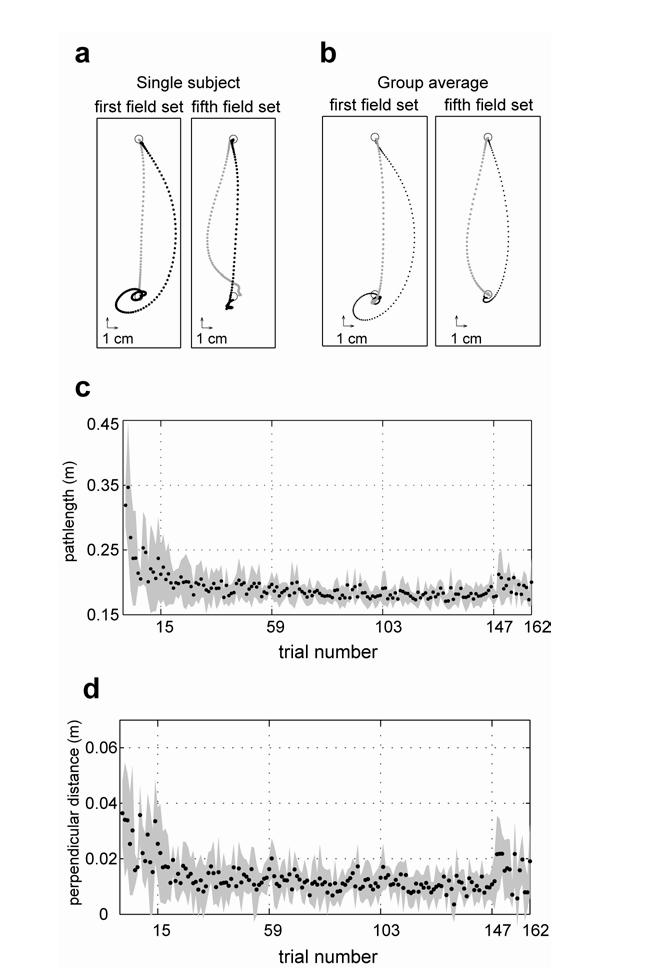
Figure 2.
Hand trajectories during adaptation. (a) Hand paths in a typical subject for four representative trials, sampled at 200 Hz. Grey dots are from a trial in the null field. Black dots are from a trial in the force field. (b) Averaged hand paths across six subjects in the same format as (a). Movements were aligned to hand position at peak hand speed. (c) Path length as a function of trial number for movements toward 0°. The shaded area represents the standard deviation across subjects. Vertical dotted lines indicate each of the 5 field sets. In the first and last field sets, movements were performed in all 16 directions whereas in the middle 3 field sets, movements were only toward 0° and 180°. (f) Perpendicular distance at peak speed as a function of trial number (mean+/-SD).

