
Figure 4.
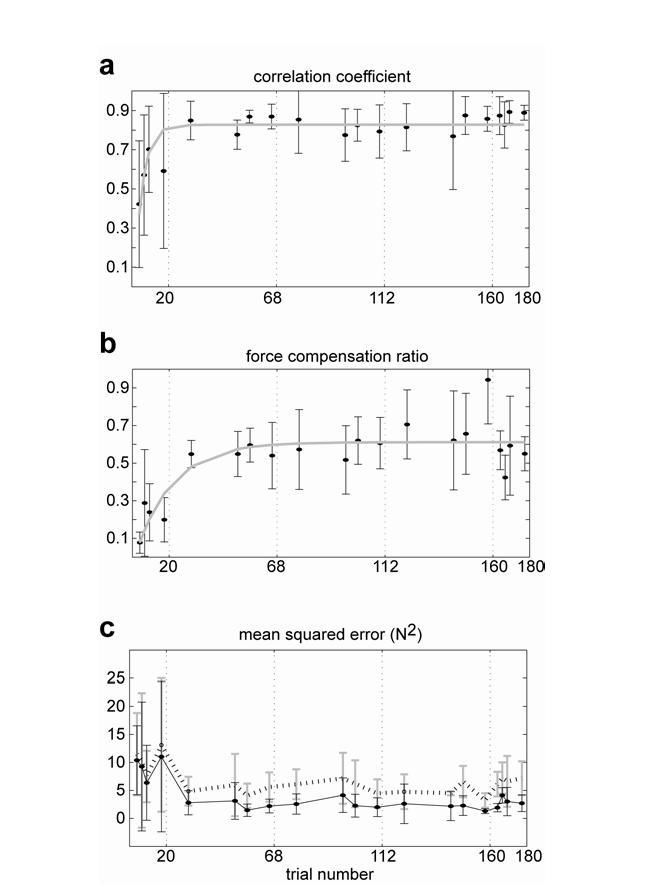
Evolution of forces during adaptation. (a) Correlation coefficient between forces produced in the channel trials and forces fa required for compensation of the field. Each dot indicates a channel trial (mean+/SD). The solid line is an exponential fit to the data. (b) Slope of the linear regression between and fa (Eq. 4). (c) Mean squared error between and fa . The dotted line indicates the expected difference when there is no compensation for the field, i.e., .