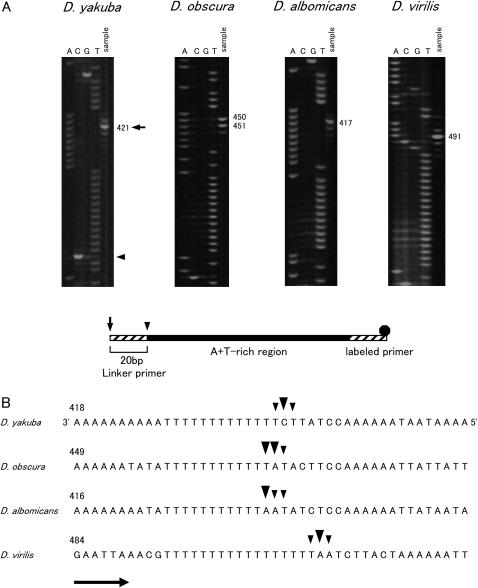
Figure 2.
Mapping of the free 5′ ends for determining the position of the ON of Drosophila mtDNA. (A) The nascent DNA strands of the minor coding strand were amplified with 5-carboxyfluorescein-labeled primer, and amplified product was resolved in a 5% acrylamide/6 m urea gel (sample lane). Sequence ladders were applied in parallel (lanes A, C, G, and T). The nucleotide positions with major signals are indicated on the right. The schematic structure of LMPCR product is shown below. Primers, the portion of the A + T-rich region, and the fluorescent dye are shown as a hatched box, solid box, and solid octagon, respectively. Arrows and arrowheads indicate the 5′ ends of the PCR products and free 5′ ends of the nascent DNA strands. (B) Location of the free 5′ ends marking the ON. The site of the nucleotide with the free 5′ end is corrected by 20 bases for the length of the linker from the site where the signal was observed in A. Large arrowheads indicate the sites where major signals were observed and small arrowheads show the sites where minor signals were observed. Arrows indicate the direction of replication. The sequences of the template strands are in the middle portion of the A + T-rich region. The sequences shown for D. yakuba and D. virilis are from Clary and Wolstenholme (1985, 1987), respectively. The numbering above the sequence begins with the nucleotide that is next to the tRNAIle gene and proceeds through the A + T-rich region. Nucleotide position 1 for the sequence of D. yakuba corresponds to position 16019 of the sequence for the same species according to Clary and Wolstenholme (1985). The actual length of the T-stretch in the major coding strand for the strains in this study is 18 bp for D. virilis.

