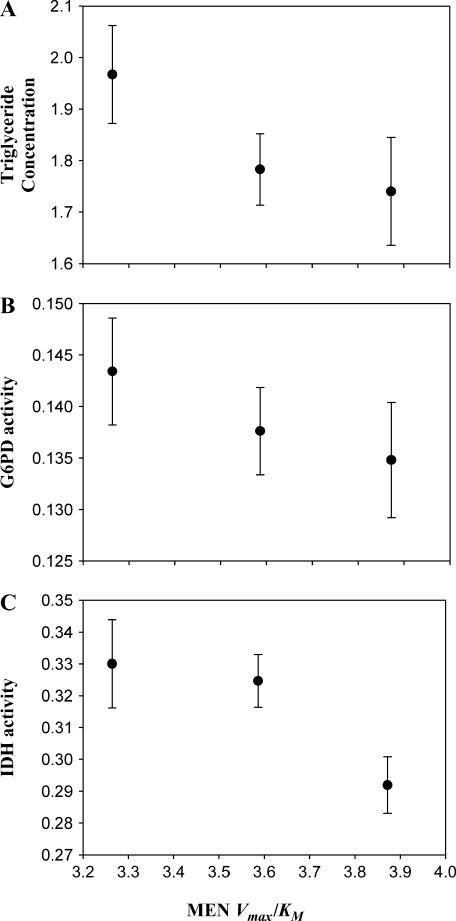
Figure 3.
Relationship between triglyceride concentration (micrograms per microgram protein), IDH activity or G6PD activity (10,000 × μm NADPH/min/μg protein), and predicted in vivo MEN activity (Vmax/Km) of the Men genotypes. The genotypes are, left to right, MenG/G, MenG/A, and MenA/A. Error bars indicate one standard error.

