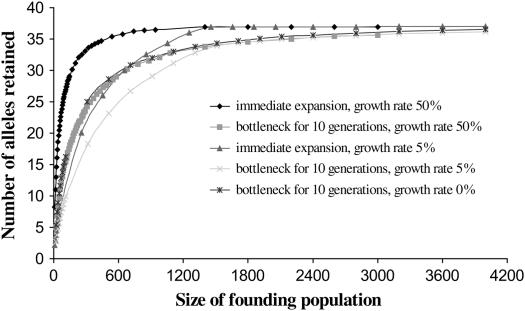
Figure 2.
The number of alleles retained in a population as a function of founder population size, after a 0- or 10-generation bottleneck followed by 0, 5, or 50% per generation population growth (from computer simulations). Bottleneck duration and subsequent population growth rate are indicated for each curve.

