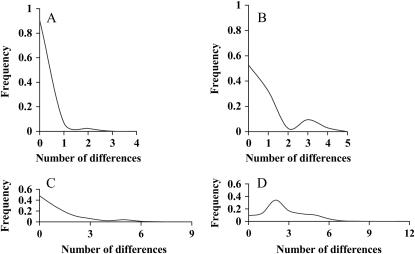
Figure 3.
Frequency distributions of nucleotide differences among pairs of individuals in population samples of least and crested auklets. (A) Cytochrome b alleles among least auklets [r = 0.704; raggedness statistic (Harpending 1994)]; (B) cytochrome b alleles among crested auklets (r = 0.137); (C) α-enolase alleles among least auklets (r = 0.0926); (D) α-enolase alleles among crested auklets (r = 0.0472).

