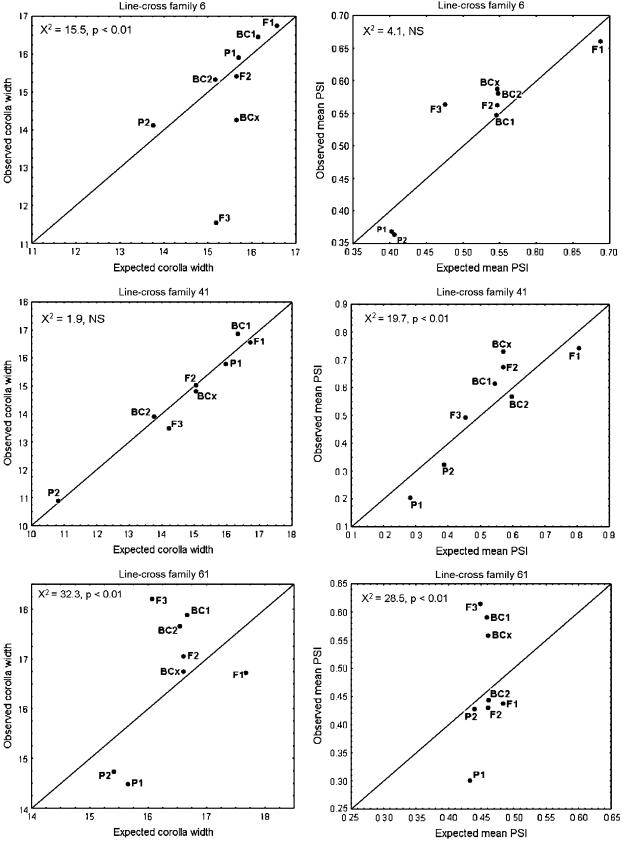
Figure 3.
The correspondence between observed and expected phenotypic values is depicted for corolla width (left column) and PSI (right column) within three different line-cross families. Each point denotes a particular line-cross derivative. The chi-square and P-values are based on that trait within that line-cross family.

