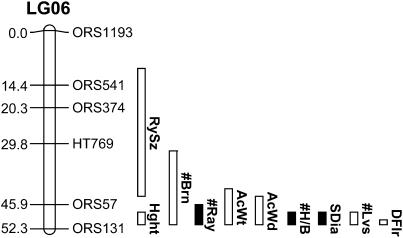
Figure 1.
Genetic map of sunflower LG06 depicting the occurrence of numerous domestication-related QTL with effects in the “wrong” direction. Map distances (in centimorgans) are listed to the left of each linkage group, whereas marker names are listed to the right. Vertical bars to the right of each linkage group reflect the 1-LOD support intervals for the location of each QTL. Solid bars indicate QTL with effects in the expected direction, whereas open bars indicate QTL with effects in the wrong direction. DFlr, days to first flower; #Lvs, number of main stem leaves; SDia, stem diameter; #H/B, number of heads/branch; AcWd, mean achene width; AcWt, mean achene weight; #Ray, number of ray flowers; #Brn, number of lateral branches; RySz, size of ray flowers; Hght, height at flowering.

