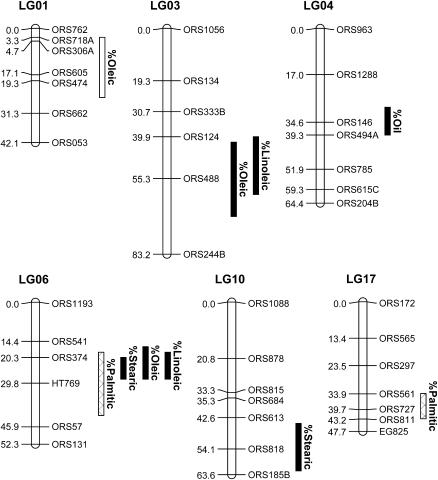
Figure 2.
Genetic map of six linkage groups showing the locations of QTL underlying various measures of seed oil content and composition in a cross between cultivated and wild sunflower. Map distances (in centimorgans) are listed to the left of each linkage group, whereas marker names are listed to the right. Vertical bars to the right of each linkage group reflect the 1-LOD support intervals for the location of each QTL. Solid bars indicate QTL with effects in the expected direction, whereas open bars indicate QTL with effects in the wrong direction. The cross-hatched bars reflect the fact that no expectation could be established for palmitic acid content.

