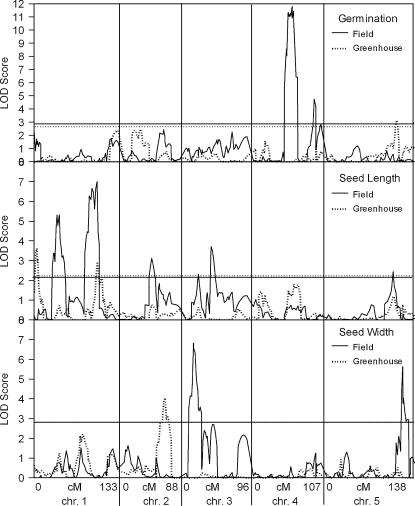
Figure 1.
Comparison of field and greenhouse QTL LOD scores. This displays the output of WinQTLCartographer (Wang et al. 2004) composite interval mapping as QTL LOD score vs. genetic map position for the traits that were measured from lines grown in both field and greenhouse environments. (Top) Seed germination; (middle) seed length; (bottom) seed width. Field growth is a solid line, while greenhouse growth is a dashed line. Horizontal lines represent the significance levels established by permutations.

