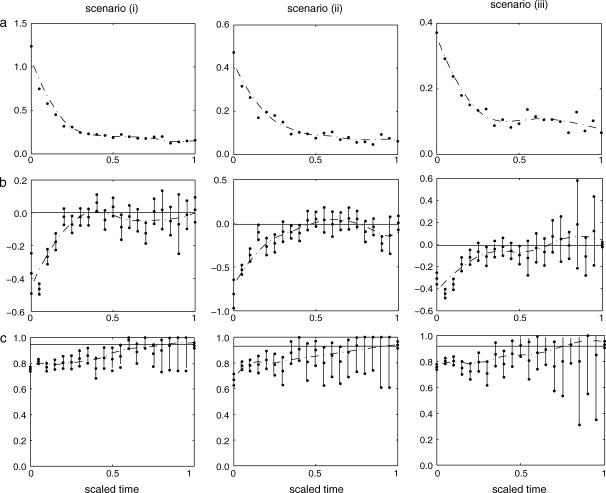
Figure 4.
Measures of accuracy in intervals for the simulation experiments for scenarios i, population of constant size; ii, exponentially growing population; and iii, structured population. Estimated (a) relative errors, (b) bias, and (c) coverage probabilities are shown. The straight line in subplot b corresponds to zero bias, while the one in subplot c corresponds to 95% coverage. The vertical error bars in subplots b and c represent 95% C.I.'s for the corresponding quantities, while the dotted lines are smoothed versions of the respective estimates.

