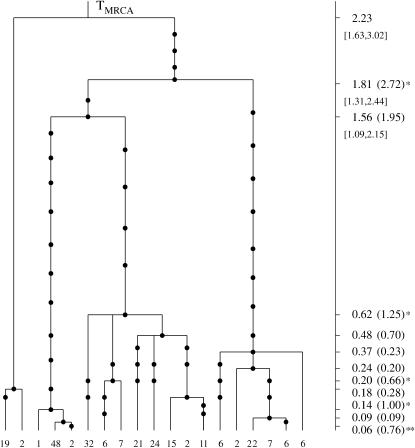
Figure 6.
The genealogical tree for a sample from the population S. sclerotiorum. The 19 distinct haplogroups in the sample are represented at the tips of the tree by their multiplicities in the sample. Mutations are represented by solid circles on the branches of the tree. The MLEs of the coalescence times, in units of Ne generations, are given on the vertical timescale on the right of the tree. The Carbone and Kohn estimates are also given in parentheses and substantially different estimates are marked with asterisks. Likelihood-based C.I.'s for the oldest coalescence times are given in brackets below the respective point estimates.

