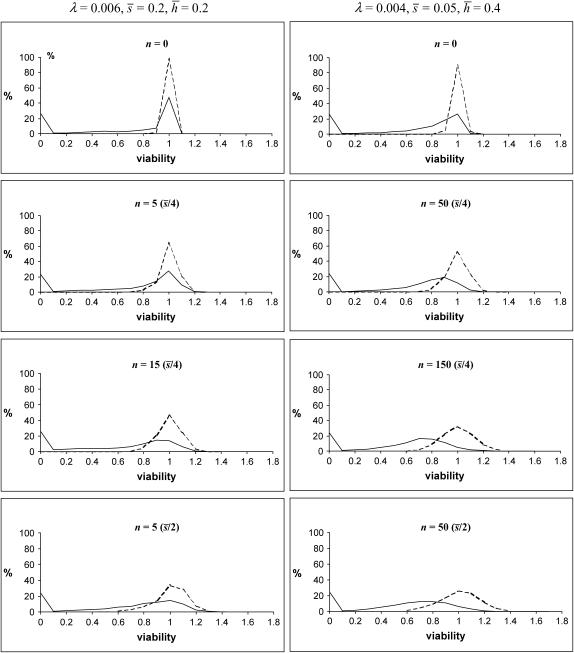
Figure 2.
Distribution of homozygous (continuous) and heterozygous (discontinuous) chromosome viabilities for different numbers (n) of antagonistic pleiotropic mutations segregating per chromosome (their average viability effects in parentheses). The two columns refer to predictions using mutational parameters λ = 0.006,  ,
,  and λ = 0.04,
  ,
,  , respectively (λL = 0.006, sL = 1, and hL = 0.02 for lethals). Results were obtained by diffusion approximations for nonpleiotropic mutations and by transition matrix for antagonistic pleiotropic ones.

