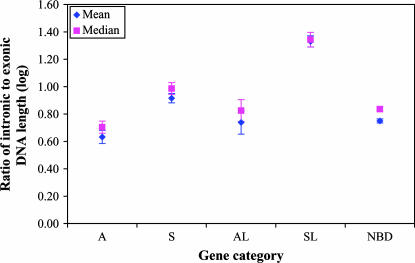
Figure 1.
Comparison of the ratios of intronic-to-exonic length among the five gene categories. The S (sense) and A (antisense) genes form SA (sense-antisense) gene pairs with exon overlaps, while the SL (sense-like) and AL (antisense-like) genes form NOB (non-exon-overlapping bidirectional) gene pairs without exon overlaps; both SA and NOB pairs are bidirectional (BD) gene pairs. NBD (nonbidirectional) genes contain only single-direction transcribed sequences. We classified the S and A or SL and AL genes in each bidirectional gene pair mainly on the basis of the conventional concept (e.g., Lipman 1997) that the S (or SL) gene should exist in more tissues and/or be expressed at a higher level than its A (or AL) partner gene (Chen et al. 2004, 2005a,b). The mean and median values with their 95% confidence intervals of the logarithm (log) values of the ratios of intronic-to-exonic DNA length are shown in the plot. Note that the original values are not normally distributed, but the logarithm values are almost normally distributed. Thus, we use independent samples t-test and Mann-Whitney U-test to determine significance (P-value) in their mean-value and median-value differences in the logarithm ratio data, respectively. The A and AL genes have significantly lower ratios of intronic-to-exonic DNA length (P < 10−4) compared with the S and SL genes, respectively. In addition, the mean and median values of the logarithm ratios in the AL genes are significantly lower (P < 0.001) than in the S genes and similar to the NBD genes. The A genes have the lowest ratios among the five gene categories, which is in accord with the efficiency selection model (Chen et al. 2005a). The detailed values of the original and log-transformed data as well as the significance (P-values) of the comparisons based on the logarithm values are shown in Table 1. In fact, we observed a similar pattern in analysis of the original data. Although the mean value of the original ratios is higher in the AL genes than in the S and NBD genes, the median value of the original ratios as well as the mean and median values of the logarithm ratios in the AL genes is significantly lower (P < 0.001) than in the S genes and similar to the NBD genes. Indeed, we observed that the high mean value of the original ratios in the AL genes was caused by a very small group of extreme big ratios (data not shown).

