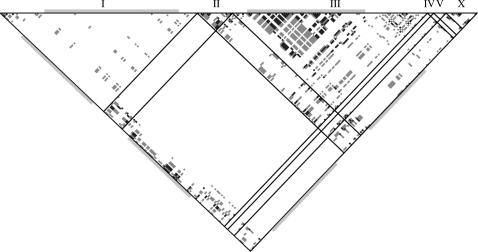
Figure 3.
Linkage disequilibrium between SNPs of C. elegans. Sites from different chromosomes are demarcated by lines. Shadings indicate Fisher's exact test significance levels: light shading, P < 0.05; dark shading, P < 0.01. Rectangles with light shading along the perimeter indicate short stretches of sequence on chromosomes I and III with many SNPs (Koch et al. 2000).

