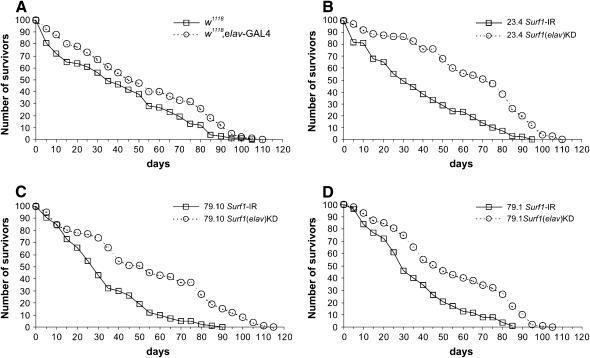
Figure 7.
Graphs showing the number of adult flies surviving after up to 115 days. (A) w1118 (the background used for transgenesis) and elav–GAL4 x w1118. (B) 23.4 Surf1 IR and elav–GAL4 KD23.4. (C) 79.10 Surf1 IR and elav–GAL4 KD79.10. (D) 79.1 Surf1 IR and elav–GAL4 KD79.1. For each graph the statistical comparison of the pairs of curves (i.e., KD vs. parental IR line) was done using the Wilcoxon test. (A) P = NS; (B) P = 0.008; (C) P = 0.02; (D) P = NS.

