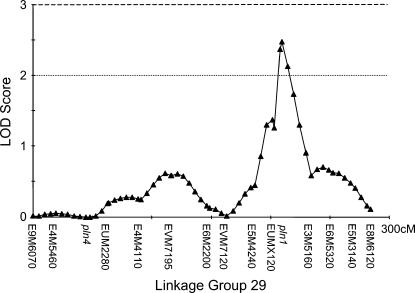
Figure 2.
One putative quantitative trait locus was detected in the high backcross with a likelihood odds ratio (LOD) score of 2.5, explaining 11.7% of the phenotypic variance. It coincided with the previously mapped pln1-QTL. A priori LOD thresholds for significant and suggestive QTL are indicated by a broken and a dotted horizontal line, respectively.

