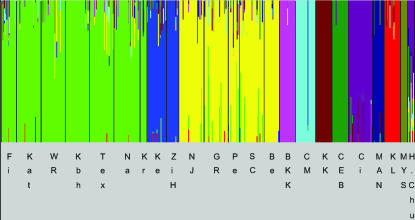
Figure 1.
Estimated population structure. Genetically distinct groups are indicated by distinct colors. (Bottom) The populations constituting a group. Each individual is represented by a thin line, which is partitioned into colored segments that represent the individual's estimated membership fraction in the corresponding clusters. See Table 1 for abbreviations of populations. Europe: Fi, Kat, WR, Kbh, Tex, Na, Kr; Africa: Ke, ZiH; America: NJ, GR, Pe, Sc, Be; Asia: BKK, CM, KK, CEB, Ci, MAN, KL, MYS, H.Chu.

