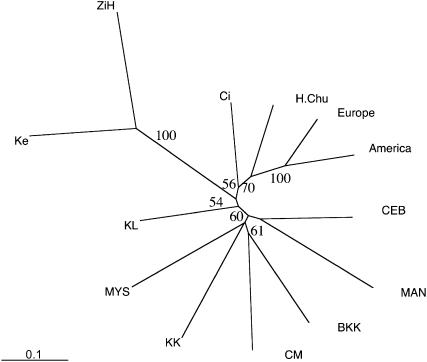
Figure 2.
Dendrogram based on the proportion of shared alleles. For more clarity, American and European populations were combined into a single operational taxonomic unit each. Bootstrap values indicate the statistical support for the corresponding node. Only bootstrap values >50 are shown. See Table 1 for abbreviations of populations.

