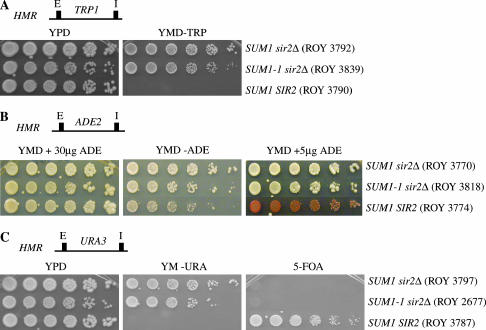
Figure 1.
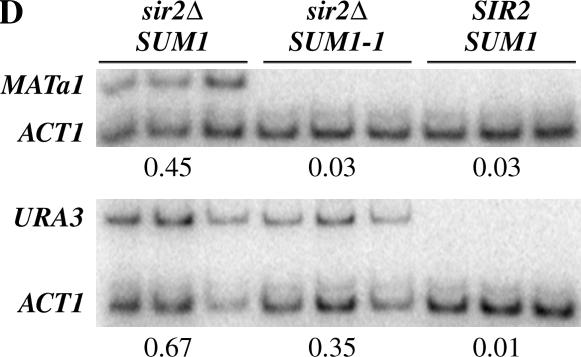
Promoter-specific repression at HMR by SUM1-1. (A) The TRP1 gene was integrated at the HMR locus, and expression of the gene was monitored by growth on YMD plates lacking tryptophan. (B) The ADE2 gene was integrated at the HMR locus, and expression of the gene was monitored by growth on YMD plates lacking adenine or containing limiting amounts of adenine. (C) The URA3 gene was integrated at the HMR locus, and expression of the gene was monitored by growth on YMD plates lacking uracil or containing 5-FOA. Approximately 3 μl of fivefold serial dilutions of overnight cultures was spotted on the different plates. Cells were allowed to grow at 30° for 2 days before the plates were photographed. The plates containing the HMR∷ADE2 strains were left at 4° for an additional day to allow for accumulation of the red pigment prior to photography. (D) mRNA levels of MATa1 and URA3 present at HMR. MATa1 and URA3 gene expression at HMR was quantitated by reverse transcribing total RNA from asynchronously growing cells followed by multiplex PCR. The levels of ACT1 mRNA along with either MATa1 or URA3 primers were quantitated. The average of the ratio of the intensities of the MATa1 or URA3 signal to the ACT1 signal was determined and is shown below.


