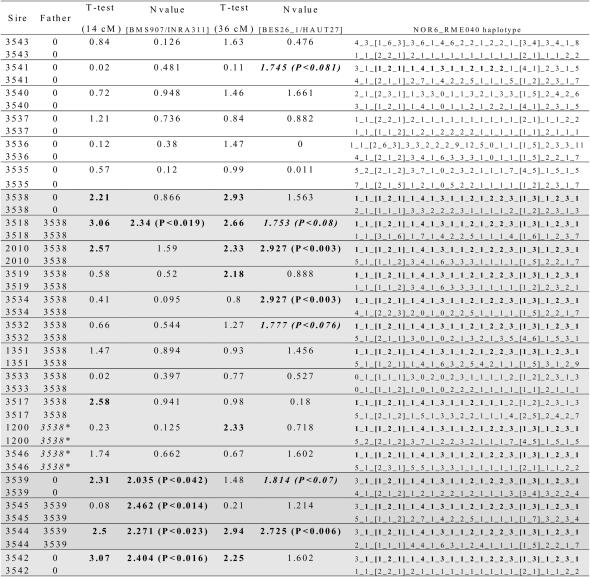
Figure 6.
Haplotypes segregating among the 21 sires of the granddaughter design. The father (or grandfather, when followed by an asterisk) is also mentioned when it is included as a sire in the granddaughter design. The N-value (see materials and methods) is given for the two most likely QTL marker bracket positions. Numbers in boldface and boldface italic type correspond to sires heterozygous at the corresponding position according to the N-statistic at a 5 and 10% significant threshold, respectively. Similarly the t-tests from regression LA are reported for the two peak positions (see text). Finally, the two haplotypes spanning the 30-cM interval containing the two QTL are included. Positions of the markers are indicated with brackets. The common haplotype supposed to carry the two favorable alleles for the two QTL is shown in boldface type.

