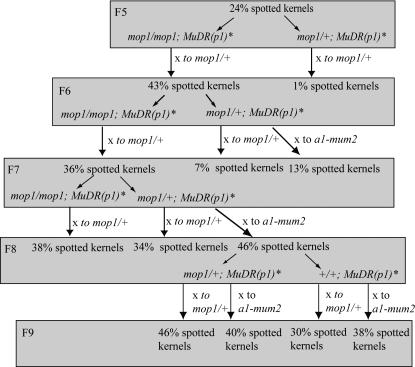
Figure 1.
Diagram of the crosses and generations discussed in this study. F5 is the first generation in which a significant percentage of kernel spotting was seen. Each generation indicates the percentage of spotted-kernel progeny produced from the previous generation as well as the genotypes selected for the crosses produced in the next generation. Arrows indicate the testcross.

