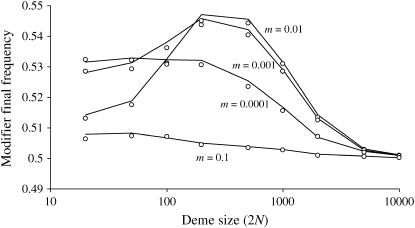
Figure 5.
Effect of population structure on modifier final frequency at the end of the sweeps (the initial frequency is 0.5) for different deme sizes 2N (x-axis) and migration rates (indicated) under strong selection (sj = sk = 1). The total population size is kept constant, 2nN = 10,000. Lines correspond to a sex modifier with the probability to reproduce sexually (with recombination rate set to  ) σ1 = 0.02, σ2 = 0.03, and σ3 = 0.04 for individuals carrying zero, one, or two copies of the modifier, respectively. Dots correspond to a recombination modifier with dr = 0.005 and rij = rjk = 0.015. Initial frequency of selected alleles is 0.01.

