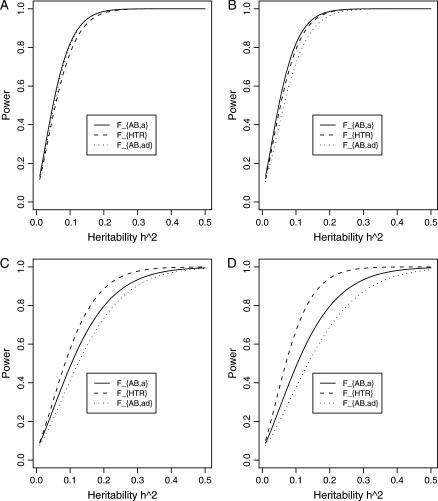
Figure 6.
Power curves of the test statistics FAB,a and FAB,ad and FHTR of the haplotype trend regression method against the heritability h2 at a 0.05 significance level, when two diallelic markers A and B are used in analysis. All parameters are the same as those in Figure 5 except that (A and B)  and (C and D)
  .
.

