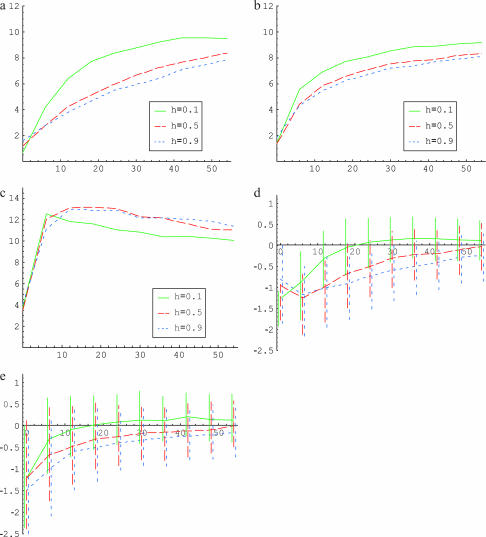
Figure 3.
The effect of strong directional selection. Average (a) θπ, (b) θW, and (c) θH are shown as functions of the distance (in kilobases) from the selected site, for different dominance coefficients. (d) Mean, 25th, and 75th percentiles of Tajima's D; (e) mean, 25th, and 75th percentiles of Fu and Li's D. Parameters are  ,
,  . The solid line (green) is for h = 0.1, the long dashed line (red) is for h = 0.5, and the short dashed line (blue) is for h = 0.9.

