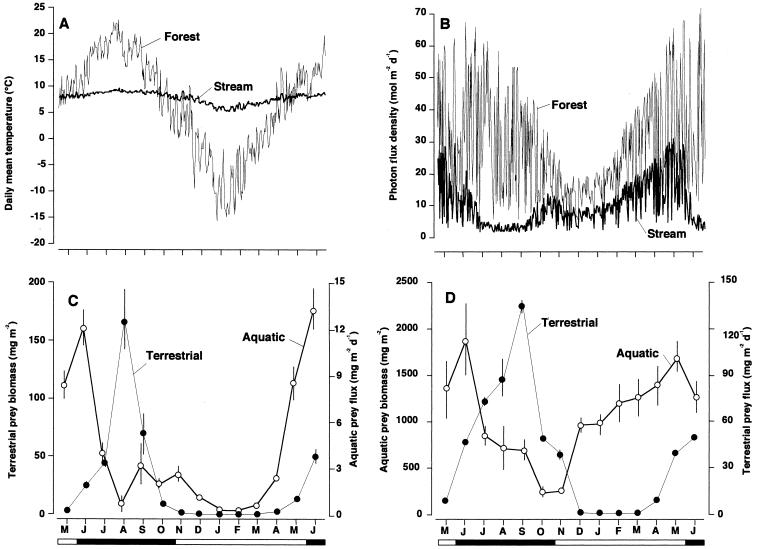
Figure 1.
Contrasts in seasonal dynamics of physical environmental variables and prey invertebrates between a forest and stream in northern Japan. Temperatures were recorded every hour in both stream and forest with automatic thermometers (Optic StowAway, Onset Inc., Bourne, MA). Light conditions were recorded every hour just above the stream surface and forest canopies with automatic photon flux density meters (LI-250, Li-Cor, Lincoln, NE). (A) Daily mean temperatures of forest and stream. (B) Daily cumulative photon flux densities at the forest canopy and stream surfaces. (C) Terrestrial prey biomass on tree foliage and aquatic prey flux to forest. Both biomass (P < 0.0001) and flux (P < 0.0001) differed significantly among months (by one-way ANOVA on log10-transformed data for both). (D) Aquatic prey biomass and terrestrial prey flux to stream. Both biomass (P < 0.0001) and flux (P < 0.0001) differed significant among months (by one-way ANOVA on log10-transformed data). Black and white circles in C and D represent mean values (±1 SEM) for terrestrial and aquatic prey, respectively. Black and white portions of horizontal bars at bottom of figures indicate leafing and defoliation periods, respectively.

