Figure 7.
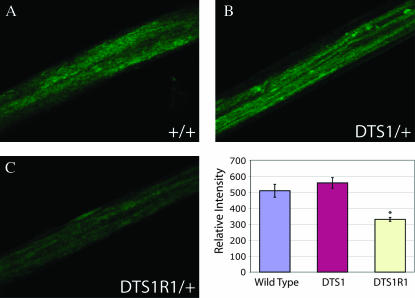
ATPα immunolocalization in axon bundles. Immunohistochemistry with anti-Na+/K+ ATPase α mAB and a fluorescence-conjugated secondary antibody was performed on larvae of the indicated genotypes. Confocal microscopy was performed under identical conditions and image acquisition parameters for all genotypes. Representative images of motor axon bundles are shown for (A) wild type, (B) ATPαDTS1/+, and (C) ATPαDTS1R1/+. ImageJ software was used for intensity analysis. Wild type had an average intensity of 509.11 ± 40.45, ATPαDTS1 had an average intensity of 558.01 ± 33.40, and ATPαDTS1R1 had an average intensity of 330.17 ± 12.28 (error given is SEM). Protein expression was not different between ATPαDTS1 and control flies, whereas ATPαDTS1R1 flies demonstrated a significant 35% reduction in ATPα expression (P < 0.001, indicated by an asterisk). N = 14 motor neurons evaluated from three independent animals.

