
TABLE 2.
Summary statistics of kernel morphology and milling quality traits
| Trait | Location | Unit | Mean | Standard deviation | Minimum | Maximum | P-value of normality testa | Intraclass correlation coefficientb |
|---|---|---|---|---|---|---|---|---|
| KW | NY | mg | 53.53 | 4.171 | 44.98 | 64.95 | 0.213 | 0.288 |
| OH | mg | 43.07 | 3.871 | 35.39 | 52.45 | 0.255 | 0.218 | |
| AREA | NY | mm2 | 21.23 | 1.269 | 18.38 | 25.24 | 0.334 | 0.271 |
| OH | mm2 | 17.73 | 1.194 | 15.24 | 20.32 | 0.394 | 0.252 | |
| LEN | NY | mm | 7.038 | 0.329 | 6.186 | 7.807 | 0.983 | 0.305 |
| OH | mm | 6.628 | 0.350 | 5.794 | 7.383 | 0.267 | 0.351 | |
| WID | NY | mm | 3.838 | 0.101 | 3.618 | 4.161 | 0.051 | 0.114 |
| OH | mm | 3.403 | 0.100 | 3.191 | 3.672 | 0.854 | 0.039 | |
| MS | OH | % | 68.54 | 11.69 | 39.32 | 97.81 | 0.855 | 0.046 |
| FY | OH | % | 77.22 | 1.135 | 74.35 | 80.03 | 0.992 | 0.027 |
| FRIA | OH | % | 28.70 | 1.342 | 25.10 | 31.87 | 0.193 | 0.105 |
| ESI | OH | % | 9.632 | 1.314 | 6.63 | 13.10 | 0.693 | 0.001 |
| BFYc | OH | % | 31.57 | 3.882 | 24.50 | 42.20 | 0.605 | 0.005 |
a
Shapiro–Wilk test.
b
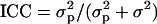 , where
  is the variance among subpopulations and σ2 is the residual variance (Neter et al. 1996).
c
Analyzed as log-transformed data.