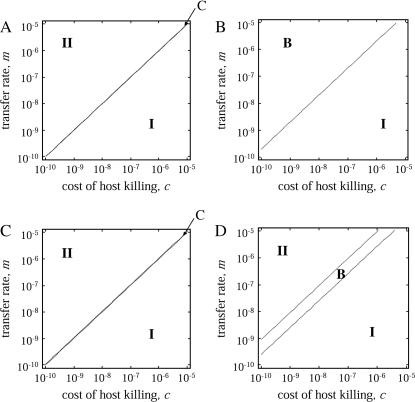
Figure 9.
Phase diagram with lower parameter values. Analytically predicted dynamic behaviors are shown in the regions on the parameter space as in Figures 3 and 7. Methods and parameters are the same as those in previous analyses, except that the values of transfer rate m and the cost of host killing c are much smaller. The four diagrams are those without (A and C) and with (B and D) competitor and in the absence (A and B) and presence (C and D) of spatial structure, respectively.

