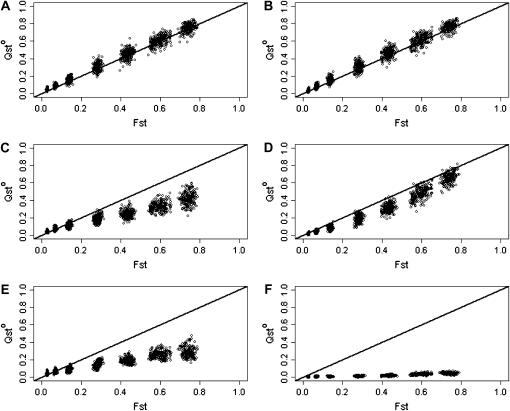
Figure 6.
Effect of the crossing design used to infer QST. (A–F) s = 0.889 (f = 0.8), and sampling is exhaustive. (A, C, and E) Variance components were estimated using a true half-sib design. For this design, QST was estimated as  . (B, D, and F) Variance components were estimated using 10 selfed offspring for each individual. For this design, QST was estimated as
  . (A and B) Purely additive trait. (C and D) Dominant trait. (E and F) Overdominant trait (no additivity).

