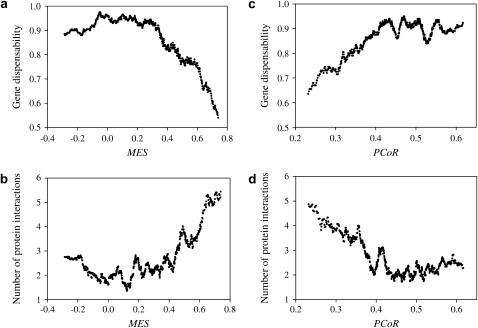
Figure 1.
Covariation with the number of protein interaction partners per gene explains the correlation between the MES or PCoR and gene dispensability. In a and b, duplicate gene pairs are sorted by MES, and the average MES and average gene dispensability are computed for a window size of 100 duplicate pairs, with the sliding window moving every gene pair. In c and d, duplicate genes are sorted by PCoR. A total of 1432 pairs of yeast duplicate genes with dS > 1 are analyzed here.

