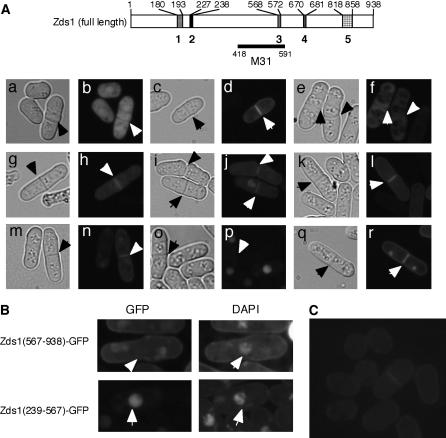
Figure 7.
The localization of various Zds1–GFP fusion proteins. Cells were cultured in PMA containing thiamine at 30° until they reached the stationary phase. The cells (at a density of 1 × 10⁵ cells/ml) were then inoculated into PMA without thiamine and further cultures at 30°. After 18 hr, the cells were observed under a fluorescent microscope. (A) MY6010/pSLF172L GFPS65A (a and b), MY6010/pSLF172L Zds1–GFP (c and d), MY6010/pSLF172L Zds1(1–669)–GFP (e and f), MY6010/pSLF172L Zds1(1–817)–GFP (g and h), MY6010/pSLF272L Zds1(194–938)–GFP (i and j), MY6010/pSLF172L Zds1(239–938)–GFP (k and l), MY6010/pSLF172L Zds1(573–938)–GFP (m and n), MY6010/pSLF172L Zds1(239–567)–GFP (o and p), and MY6010/pSLF172L Zds1(682–817)–GFP (q and r). Phase-contrast microscopic photographs (a, c, e, g, i, k, m, o, and q) and fluorescent microscopic photographs (b, d, f, h, j, l, n, p, and r) were taken. (B) Localization of Zds1ΔNΔC–GFP in nuclei. Cells were stained with DAPI and observed under a fluorescent microscope. (C) Localization of the Zds1–GFP fusion protein in the zds1–GFP integrated strain, MY6013. Cells were cultured in YES at 30° until they reached the stationary phase. They were then cultured in PM plus adenine and uracil until the midlog phase, washed with H2O and then with nitrogen-free PM medium, and resuspended in nitrogen-free PM medium. After 6 hr, the cells were observed by fluorescent microscopy.

