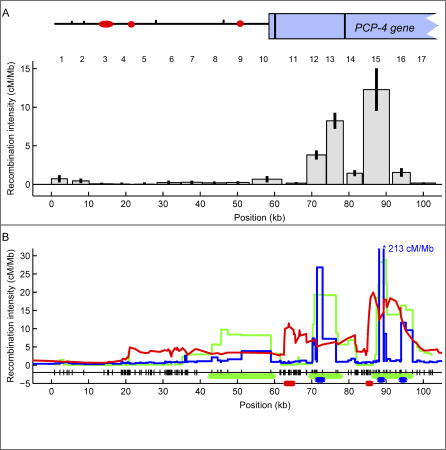
Figure 2. Recombination across a 103-kb Region in Chromosome 21.
(A) The histogram shows the recombination intensities measured in 17 intervals (the interval number is shown on top of each bar) of the 103-kb region of Chromosome 21. For intervals 13 and 15 we plotted the average of both reciprocal crossovers. Shown on top of the histogram is the genetic structure of the region (circles/ovals represent long interspersed nuclear elements and short interspersed nuclear elements, tick marks represent long terminal repeats, and the rectangle represents the partial PCP4 gene; exons are shown as black vertical lines). The recombination intensity in cM/Mb is corrected for false positives. Gaps represent areas where no recombination data could be collected. The 95% confidence interval for each measurement is shown as an error bar.
(B) Recombination intensities calculated with three different LD estimators: LD-Hat in green, Hotspotter in blue, and ABC in red. Note that the predicted peak at ~90 kb (interval 15) for Hotspotter is 213 cM/Mb and thus off scale. All three estimators used the Perlegen SNP database [35]. SNPs are shown as marks next to the x-axis. The thick green, blue, or red horizontal lines above the x-axis mark the region with statistical support for a hot spot in LDHat, Hotspotter, or ABC, respectively. See Materials and Methods and Table 1 for details and Protocol S6 for a list of estimated recombination intensities for all three algorithms in our region.

