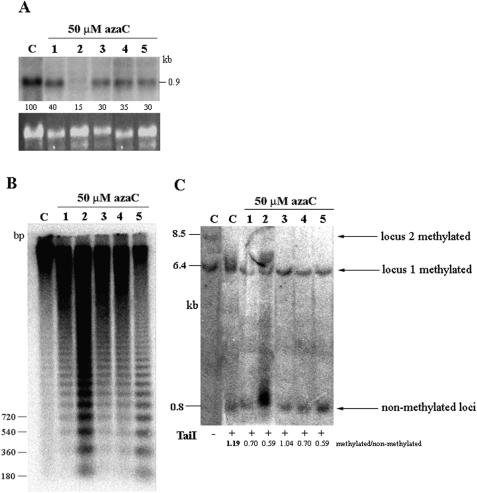
Figure 7.
Expression and methylation analysis in hypomethylated Lo1E/Lo2 plants. (A) RNA gel-blot hybridization of the nptII RNA isolated from 5-aza-2-deoxy-cytidine (azaC)-treated (1–5) and non-treated (C) plants. The numbers below the lanes indicate relative signal intensities of the nptII-specific band. The signals were normalized by ethidium bromide fluorescence of the 25S rRNA gene (bottom panel). The signal in the control lane (C) was arbitrarily chosen as 100%. (B) DNA methylation in the endogenous HRS60 satellite analyzed by HpaII restriction enzyme. (C) DNA methylation in the 35S promoters analyzed by TaiI restriction enzyme (+) as described in Figure 5. DNAs were predigested with BglII to separate both loci. The ratio between methylated/non-methylated fragments are indicated below the lanes.

