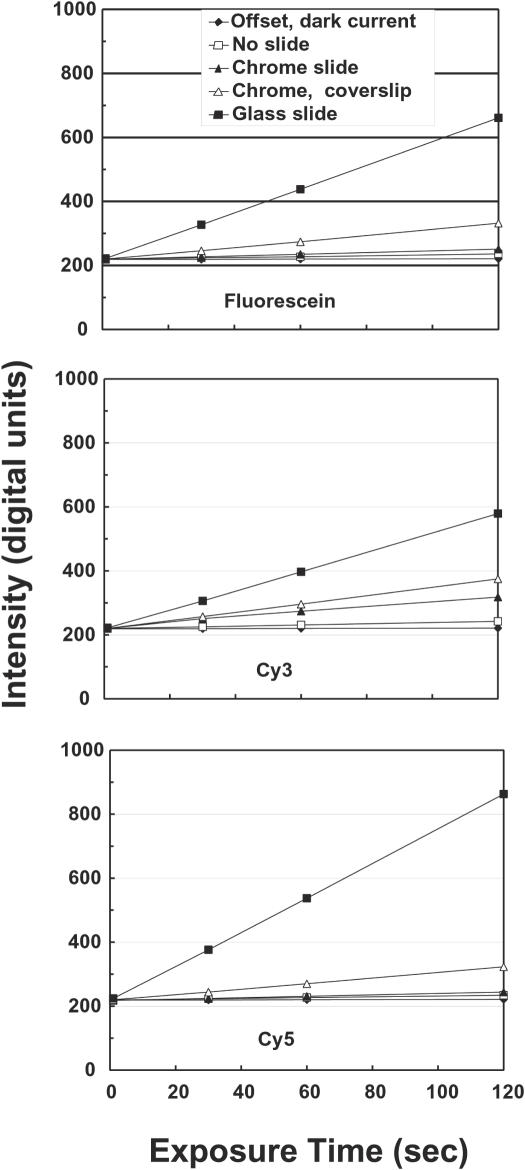
Figure 2.
System offset and background light levels as a function of exposure time for various measurement conditions. Intensity at the center of the image as a function of exposure time is shown for the system when no array is present, and for a bare chromium substrate, a chromium substrate plus coverslip and a glass slide. In addition the camera output with the excitation light off is also shown to demonstrate the camera offset and dark current. The key to identify the various curves is located in the upper graph, which shows backgrounds for the fluorescein filter set. The middle and lower graphs provide similar information for the Cy3 and Cy5 filter sets, respectively. The data show that the camera offset is ∼220 U, and that the dark current of the camera is negligible over these integration times. These curves allow estimation of the background light levels due to the array substrate and mounting components. For example, typical integration times for our measurements are 20–40 s for Cy3 and Cy5, which result would result background contributions of 20–50 digital units for the chrome slide plus coverslip in an actual array measurement. Background for the standard glass slides are much higher, and are variable among batches of slides perhaps due to trace differences in their compositions. Total backgrounds in real array measurements will be higher than in this figure due to non-specific binding during the hybridization. Figure 9 shows the effect backgrounds on measurement precision.

