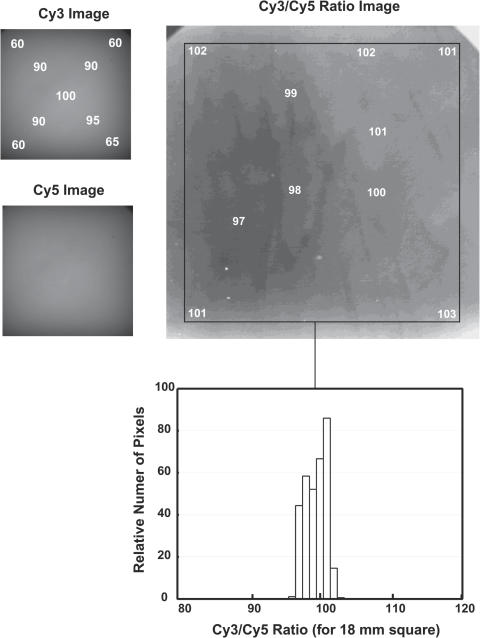
Figure 3.
Illumination distributions over the object field. Images of fluorescence from a smoky gray translucent plastic test sheet were obtained using the Cy3 and Cy5 filter sets. The intensity pattern in the image directly indicates the illumination pattern because the detection optics provide essentially uniformity of the sensitivity over the field. At the left, images of the full-field illuminations for Cy3 and Cy5 are shown, with the relative intensities at representative locations in the field indicated. The intensities are highest in the center, and drop to ∼60% of the central value at the corners of the 18 mm area used for array imaging. The dark areas at upper left and upper right corners of the images are due to obstruction of the light path by the boundaries of the open camera shutter. The (linear) ratio of these two images, smoothed using a median filter with a radius approximately the size of an array element (3 pixels) and contrast-stretched so that 1% changes result in a change in gray level, is shown to the right. Relative (linear) ratio values for the various gray levels are indicated on the image within a black boundary that indicates the area of an 18 mm square array. A histogram, bottom, of the intensity values within the 18 mm square shows that the full range of this distribution is ±4%, with most of the image within ±3%.

