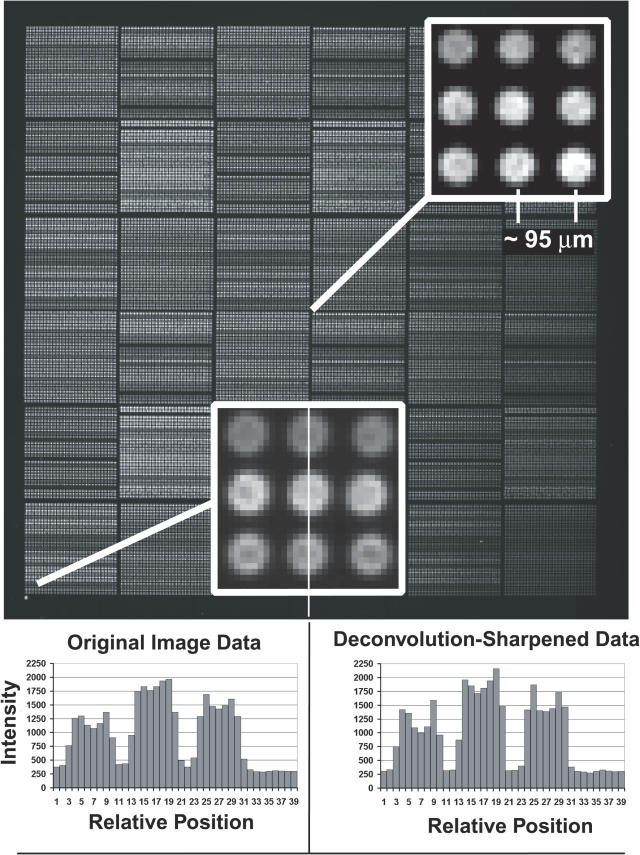
Figure 5.
DAPI image of ∼30 000 element test array. DNA was printed from 864-well microtiter plates (3 mm well spacing) using our custom-built array printer (S. Clark, G. Hamilton, N. Brown, V. Oseroff, R. Nordmeyer, D. Albertson, D. Pinkel, manuscript in preparation). Large numbers of replicate spots were printed for each solution, leading to the stripped appearance which represents differences in the DNA concentrations in the printing solutions. The elements are printed on ∼95 µm centers. Expanded views of the image from a region at the center and in the lower left corner show the elements are well resolved. The printing pin used at the center of the array produced spots of ∼60 µm diameter, while that at the lower left made elements with a diameter of ∼70 µm. Pixel intensities are shown for a vertical line through three spots in the lower left corner for the original image data, and after deconvolution sharpening of the image. The signal level between the elements is due to a combination of camera offset, ∼220 U, fluorescence from free DAPI in the mounting medium, and slight softness in the image. The softness is seen by the slight elevation of the intensities in the troughs between array elements compared with the intensity in the image outside of the area of the array (pixels 33–39 in this plot). Intensities along diagonal lines connecting the elements fall fully to ‘background’ levels (data not shown). Deconvolution image sharpening (using a Wiener filter implemented in MATLAB) deepens the troughs to the same level as the region outside the array and improves the resolution of features of spot morphology.

