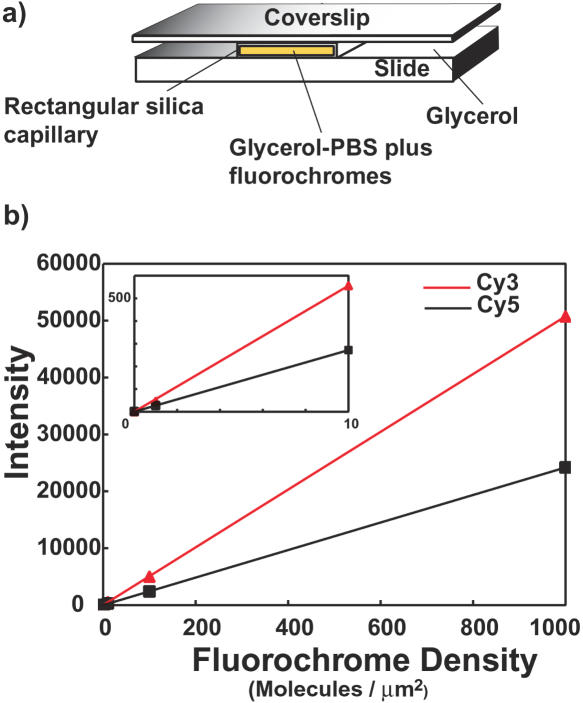
Figure 6.
Detection sensitivity. (a) Glycerol-PBS solutions containing known concentrations of Cy3 and Cy5 were loaded into rectangular fused silica capillaries, placed on a chromium-coated microscope slide, surrounded by glycerol and a glass cover slip applied. This mounting closely matched the indices of refraction of capillaries (fused silica ∼1.459, glycerol ∼1.473) so that very little light scatter was generated at the capillary surfaces. Five capillaries were mounted in an image field, each containing a mixture of Cy3 and Cy5 at concentrations of 0, 1, 10, 100 and 1000 molecules/µm2, and Cy3 and Cy5 images acquired. Concentrations of stock solutions were determined using absorbance measurements and known extinction coefficients. (b) Fluorescence intensities Cy3 (red curve) and Cy5 (black curve) increased linearly with fluorochrome density. The inset shows the portion of the curves between 0 and 10 fluorochromes/µm2, indicting the ability to detect concentrations below 1 fluorochrome/µm2.

